

Standard compliant QUAlity control System for High-level ceramic
material manufacturing (SQUASH)
INCO-COPERNICUS, grant no. ERBIC 15CT 96 0742. 1997-98.
Co-ordinated by the University of Cagliari, Italy,
in cooperation with
AET - Advanced Engineering Technology S.r.l., Italy
The
Association for Image Processing,
Poland, was one of the contractors.
The main page of the Project
Abstract of the results obtained and owned by the
Association for Image Processing, PL
Detection and Classification of Surface Irregularities
in Black Ceramics
L. Chmielewski,
M. Skłodowski,
W. Cudny,
M. Nieniewski
Association for Image Processing
and Institute of Fundamental Technological Research, PAS
A. Jóźwik
Institute of Biocybernetics and Biomedical Engineering, PAS
Presentation of the Project
(PowerPoint, 2.5 MB)
given at the
International Workshop on Structural Image Analysis in Investigation of
Concrete
October 21-23, 2002, Warsaw, Poland
organized by the
Institute
of Fundamental Technological Research, PAS - Center of Excellence for Advanced Materials and
Structures
1 Overview
Manufacturers and buyers of black ceramics distinguish numerous classes
of surface irregularities (defects) of black ceramics. However, only some
irregularities of selected surfaces have been chosen for the present research,
due to their high importance to the quality of the final products.
The objects considered are mainly hard and soft
ferrite materials: ferrite cores and magnets. Other materials of similar
appearance can be inspected in the same or similar way.
The monochromatic images of the irregularities of
interest are acquired by the system consisting of a highly specialised
lighting system [EPS97], a standard digital camera, and a computer.
A hierarchical method for classification of a core
with respect to surface irregularities has been applied. It consists of
two main phases:
-
Detection phase. Regions which might be irregular are detected.
In this phase three detectors are used: dynamic thresholding, a morphological
detector of elongated irregularities, and a morphological detector of compact
irregularities. The latter is hierarchical in itself: the morphological
pyramid technique has been used
[Nie97, NN97].
In detecting the irregularities
of different sizes the structuring elements are kept the same, but the
image is scaled down, to reduce the time of computations. If a hardware
morphological processor were applied, this phase would take milliseconds. The
results obtained are reliable enough to initially classify very defective
objects as generally bad.
-
Classification phase. Pixels of the regions selected in the
detection phase are classified with a highly advanced version of the K
nearest neighbours method (K-NN)
[Joz83, Joz96].
The features used were
selected from a large number of possible deterministic, statistical and
textural measures, with the use of numerous training samples. For an object
which passed the preclassification in the detection phase, this process
can take from 2 to 10 seconds (Pentium, 200 MHz).
The whole method is complemented by postproccessing the results of the
classification phase: the context information is taken into account by
a local weighted voting process.
Finally, the irregularities are measured, and the
results are compared with quality standards to get the final classification
of the product as belonging to a respective quality class. Quantitative
nature of the measurements make them useful in analysis of the production
process.
2 Types of considered irregularities
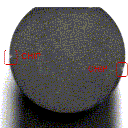
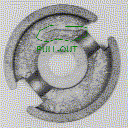
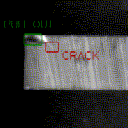
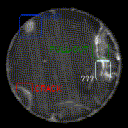
The surface irregularities considered are: chips, pull-outs and cracks (Fig. 1).
 a
a |
 b
b |
 c
c |
 d
d |
Fig. 1. Various types of irregularities:
a: chips; b: pull-outs; c: pull-out and crack; d: various, might be difficult
to discern.
3 Training and classification
The classifier applied to feature-based classification of the pixels
marked as possibly irregular by the detection phase is a highly advanced
version of the K-NN method, having the following properties:
1o fuzzy,
2o parallel (1 classifier for each pair of classes),
3o with full selection of features,
4o hierarchical (a simple 1-NN version is used where classes
do not overlap in the feature space),
5o with reduced reference patterns set.
This combination leads to high speed and accuracy of classification.
The used 64 features were the textural features
[Law80] and local section of brightness function
[CSCMJ97].
From the point of view of the user it is important
how to prepare the data for training the classifier. The training process
has been organised in such a way that its main part consists in showing
examples of image pixels which belong to all classes defined for the specific
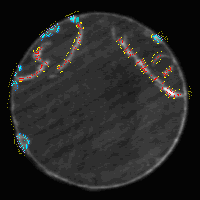
problem. This is done by manually marking such pixels in colours (Fig.2).
A large number of training pixels (training patterns) coming from each
class should be given to obtain good final classification results.
In the examples presented in Fig. 2, there were 4297 training pixels
prepared. With this large set, the global classification error rate
estimated by the classifier on the training set was was 3.3% (with the
leave-one-out method
[Bez86, Das95,
CSCMJ97]). Keeping this measure
of error small is a necessary, but not a sufficient condition of receiving
a classifier with acceptable generalisation power
(ability to correctly classify the patterns which it has never seen).
Good final results for a large set of example images should be received
first - see Fig. 2.
It is the experience gained in this research that
for good classification, each class should be divided into subclasses.
Let us take an example of a chip. The following six derived classes have
been introduced: dark chip, bright chip, edge between a chip
(dark and bright separately) and good object, edge between a chip (dark
and bright) and background. After classification, all these classes are
merged into one: chip.
The fully automated process of training the classifier
consists in
forming the reduced sets of reference patterns for all class pairs, selecting
the most significant features for each pair of classes and choosing K
(the number of neighbours in the feature space) for each pair. The size
(power) of the set of reference patterns, which is the set of representant
patterns for each class, is usually less than 10% of the size of the set of
training patterns.
4 Examples of results
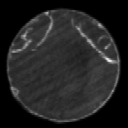
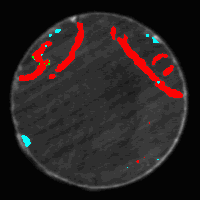
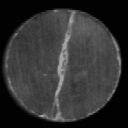
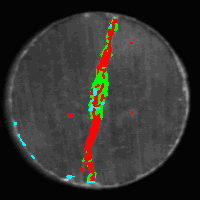
The results of classification of the images of Figs. 2 a1 and a2
can be seen in Figs. d1 and d2 (Good pixels were not marked).
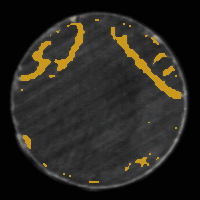
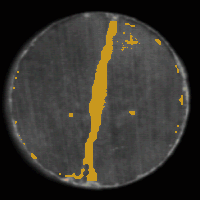
Only those pixels which were detected as irregular by the
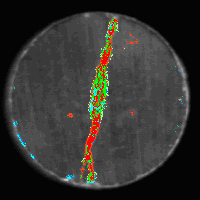
detection phase (Figs. 2 c1 and b2) were classified. After taking into
account the context information, the separated single pixels disappear
(Fig. 2 c2 and d2), and the image is ready for measuring the blobs
corresponding to various classes of irregularities.
 a1
a1 |
 b1
b1 |
 c1
c1 |
 d1
d1 |
 a2
a2 |
 b2
b2 |
 c2
c2 |
 d2
d2 |
Fig. 2. Examples of detection and
classification of irregularities.
a1: input image 1
(some pixels of this image were taken for training - see b1);
b1: training patterns taken from image a1
(blue: chip,
green: pull-out,
red: crack,
yellow: good object);
c1: detected irregular regions (brown);
d1:
results
of classification after postprocessing.
a2: input image 2
(no pixels of this image were taken for training);
b2: detected irregular regions;
c2: raw
results
of classification.
d2:
results
of classification after postprocessing.
The object shown in Fig. 2 a2 has the diameter of 10 mm.
The displayed part of the image has 200*200 pixels (0.0568 mm/pix).
The following results have been obtained for that object:
Total area of irregularities: 6.18 [mm2]
|
#
|
CLASS
|
blobs
|
type
|
max blob
|
total
|
quality
|
|
3
|
CHIP
|
12
|
AREA
|
0.11/0.50 [mm2]
|
0.57/1.00 [mm2]
|
GOOD
|
|
7
|
PULL-OUT
|
24
|
AREA
|
0.89/0.50 [mm2]
|
1.76/1.00 [mm2]
|
BAD!
|
|
10
|
CRACK
|
19
|
LENGTH
|
3.46/1.50 [mm]
|
11.76/3.00 [mm]
|
BAD!
|
!!! this object is BAD !!!
The classification took about 12.4 s
(Pentium, 200 Mhz; note that for an object with less irregularities the
classification would be proportionally quicker - classification of one pixel
- 0.0032 mm2 - takes approx. 6.5 ms).
The detection carried out by software took 10 s
(the same process would take less than 0.05 s if a typical hardware
morphological processor were used).
5 Conclusions
 A hierarchical computerised optical inspection system for detection and
classification of defects (called irregularities) on flat surfaces of
products of black ceramics has been designed and implemented. Special
attention was paid to overcoming the difficulties related to dark colour
of the tested objects and to attain invariance of the phases of inspection
to such noncontrollable factors like scale of the defects and location of
the object.
The system has been found to work properly in a
series of tests. Quantitative nature of the results make it possible to
carry out various kinds of analyses of the production process.
The methodology has been developed up to a level
at which an industrial implementation is possible. For this purpose, no
other highly specialised hardware seem to be necessary than a mathematical
morphology processor.
The proposed methods are applicable to detection
of defects on flat surfaces of numerous similar (ferrite cores, magnets,
sintered carbides) and dissimilar materials.
References
-
[Bez86] J.C. Bezdek, S.K. Chuan, D.Leep, Generalized k-NN rules, Fuzzy
Sets and Systems, 18, 1986, pp. 237-256.
-
[CSCMJ97] L. Chmielewski, M. Skłodowski, W. Cudny, M. Nieniewski,
and A. Jóźwik. Optical system for detection and classification of
surface defects in ferrites. Proc. 3rd Symp. Image Processing Techniques
(TPO'97), Serock, Poland, Oct 29-31, 1997, 1-13.
-
[Das95] B.V. Dasarathy, Nearest Neighbor (NN) norms: NN pattern classification
techniques, IEEE Computer Society Press, 1995.
-
[EPS97] Light systems for testing the surface irregularities of
ferrite cores, EPSILON(R) ARG Ltd, Jan 1997 (annex to Report of the
project CRASH, CRASH Consortium, Jan 97).
-
[Joz83] A. Jóźwik. A learning scheme for a fuzzy k-NN rule.
Pattern Recognition Letters, 1, 1983, pp. 287-289.
-
[Joz96] A. Jóźwik, L. Chmielewski, W. Cudny, M. Skłodowski, A 1-NN
preclassifier for fuzzy k-NN Rule, Proc. 13th Int. Conf. Pattern Recognition,
Wien, Austria, Aug 25-29, 1996, pp. D-234 - D-238.
-
[Law80] K. I. Laws, Textured image segmentation, Univ. of Southern
California, Image Processing Institute, USCIPI Report 940, Jan 1980
(also in W. K. Pratt, Digital Image Processing, John Wiley, New
York 1991).
-
[Nie97] M. Nieniewski, Morphological method of detection of defects
on the surface of ferrite cores, Proc. 10th Scandinavian Conf. Image
Analysis, Lappeenranta, Finland, June 9-11, 1997, pp. 323-330.
-
[NN97] T.C. Nguyen, M. Nieniewski, Using genetic algorithm for optimisation
of the thresholds in the morphological pyramid for detecting defects on
the surface of ferrite cores, Proc. 3rd Symp. Image Processing Techniques,
Serock, Poland, Oct 29-31, 1997, 229-242.
 back to top
Updated: Oct 23, 2002. Last maintained: Oct 23, 2002.
Contact:
Leszek Chmielewski,
e-mail: lchmiel@ippt.gov.pl.


 A hierarchical computerised optical inspection system for detection and
classification of defects (called irregularities) on flat surfaces of
products of black ceramics has been designed and implemented. Special
attention was paid to overcoming the difficulties related to dark colour
of the tested objects and to attain invariance of the phases of inspection
to such noncontrollable factors like scale of the defects and location of
the object.
 back to top